Lab 9: Exploring Bias in Word Representations
In this lab, we will be exporing how computational representations of language reflect human biases by re-creating a plot from the paper Semantics derived automatically from language corpora contain human-like biases by Aylin Caliskan, Joanna J. Bryson, and Arvind Narayanan. In particular, we will determine whether computational representations of female-associated words (like "female" or "woman") are more similar to computational representations of professions in which there are more women (like "hairdresser") and vise-versa for male associated words (like "male" or "men") and professions in which there are more men (like "electrician"). It is worth noting that this method is limited in that it only considers binary gender and uses simple sets of words to represent “men” and “women”. You are welcome to discuss this limitation (and any possible ways to address it) in your reflection.
In addition to exploring an AI application (word respresentations) and considering ways in which AI models may be biased, you’ll get practice working with classes, dictionaries, lists, and more!
The deadline for this lab has been extended to Thursday, November 30th, to allow for incresed flexibility due to the holiday. However, Homework 8 is still due on Friday December 1st, so please plan your time accordingly! This lab is intended to be on the shorter side.
Activity 0
Partnership Planning
Before starting today’s lab assignment, exchange contact information with your partner and find at least two hours in your schedule during which you can meet with your partner to finish the lab. If you are genuinely unable to find a time, please come speak with me!
Reminder: you and your partner are a team! You should not move forward to one activity until you are both comfortable with the previous activity.
Download Starter Code and Data Files
Download this zip file which includes the starter code and data files. Make sure to click extract all if you are a windows user!
The files include:
lab9.py: where you’ll write your lab code!professions.txt: this data file stores the proportion of women in 50 professions. It was adapted from the data files provided with the Caliskan et al. paper.embeddings_toy.txt: this data file includes the example embeddings from Tuesday’s worksheet.embeddings_filtered.txt: this data file includes GloVe embeddings that you will need for the assignment. It is filtered to only include the small number of words you need for this assignment to keep the file small.
Install Matplotlib
In this lab, you will be use the matplotlib library to create a scatter plot. Install matplotlib in Thonny by clicking on Tools » Manage packages..., searching for matplotlib, and clicking install.
Activity 1
Write a method similarity in the WordEmbeddings class that computes and returns the cosine similarity between the vectors for two words that are stored in the self.embeddings dictionary.
This is the format of the self.embeddings dictionary. Note that the arguments to similarity are word1 and word2 which are both strings, such as "apple" or "orange".
{'apple': [6.0, 1.0, 1.0, 10.0], 'orange': [8.0, 2.0, 9.0, 3.0], 'shirt': [4.0, 1.0, 2.0, 0.0]}
Remember that the cosine similarity between two vectors is defined as follows for two vectors $A$ and $B$:
\[\frac{\boldsymbol{A} \cdot \boldsymbol{B}}{|A| \cdot |B|} = \frac{\sum_{i=1}^{n}A_iB_i}{\sqrt{\sum_{i=1}^{n}A_i^2}\cdot\sqrt{\sum_{i=1}^{n}B_i^2}}\]In mathematical notation, the components of the vector are indexed from 1, but in python, you will still index from 0.
You may approach this any way that you would like, as long as you do not use any external libraries or non built-in functions. If you need a hint, you can follow the general approach laid out here:
- Using the two arguments
word1andword2and the instance variableself.embeddings, create two variablesAandBthat represent the embeddings ofword1andword2, respectively.- Using a loop and basic mathematical operations, compute the dot product of
AandB(the numerator of the equation)- Using a loop and basic mathematical operations, compute the magnitude of
A- Using a loop and basic mathematical operations, compute the magnitude of
B(you can copy what you did for the previous step and make small changes)- Use the dot product and the two magnitudes to compute the cosine similarity, and return it.
Once you’re ready, you can try out this example, which tests on the same embeddings that we used on yesterday’s worksheet:
emb = WordEmbeddings("embeddings_toy.txt")
print(emb.similarity("apple", "shirt"))  # should be about 0.502
print(emb.similarity("orange", "shirt")) # should be about 0.903
Activity 2
Now, you’ll implement the method at the core of the Caliskan et al. paper. The equation is written in the paper as follows, where $w$ is a word, $A$ is a set of female-associated words, and $B$ is a set of male-associated words:
\[s(w, A, B) = \frac{\text{mean}_{a \in A} cos(w, a) - \text{mean}_{b \in B} cos(w, b)}{\text{std_dev}_{x \in A \cup B} cos(w, x)}\]If this equation looks a little bit intimidating, that’s OK! We’ll break it down here:
- $\text{mean}_{a \in A} cos(w, a)$: this is the mean of cosine similarities between $w$ and all of the words in $A$. In your method, $w$ is the
wordthat is an argument, and $A$ is theFEMALE_WORDSlist. - $\text{mean}_{b \in B} cos(w, b)$: this is the same as the equation above, except for $B$ is the
MALE_WORDSlist. - $\text{std_dev}_{x \in A \cup B} cos(w, x)$: this is the standard deviation of cosine similarities between $w$ and the words in the union of sets $A$ and $B$. Because
FEMALE_WORDSandMALE_WORDSdon’t overlap, you can simply use+to concatenate them rather than using the set union operation.
You will write a method called score in the WordEmbeddings class using this equation. There is one argument besides self, profession. This is a word representing a profession, and is $w$ in the equation above. FEMALE_WORDS and MALE_WORDS are global variables, so you can access them without passing them as arguments to score. Your function should return the score computed by the equation.
- You can use the
compute_many_similaritiesmethod to find the similarities betweenwordand all of the other words in a set.- You can use the
meanandstdevfunctions to compute the mean or standard deviation of a list of numbers. These are imported from the statistics module at the top of thelab9.pyfile.
You can test this by loading the "embeddings_filtered.txt" file, which contains the embeddings that were used in the Caliskan paper. A positive score indicates higher similarity with female-associated words, while a negative score indicates higher similarity with male-associated words. The example below shows code that you can test. Note that when I state “the scores should be”…, that is only a reflection on what the result of your computation should be, not commentary on whether these scores are “fair”.
emb_gender_professions = WordEmbeddings("embeddings_filtered.txt")
print("nurse score:", emb_gender_professions.score("nurse")) # the score should be approximately 1.69
print("engineer score:", emb_gender_professions.score("engineer")) # the score should be approximately -1.24
Activity 3
Call the create_plot function, which will create a plot called bias.png (it will be saved in the same folder that your code in). This is a scatter plot showing the percentage of words in each profession on the x-axis and the association of each profession with male and female words on the y-axis (computed using your score method). create_plot takes one argument, a string with the names of your group members which will be inserted into the title of the plot. Here’s my plot as an example:
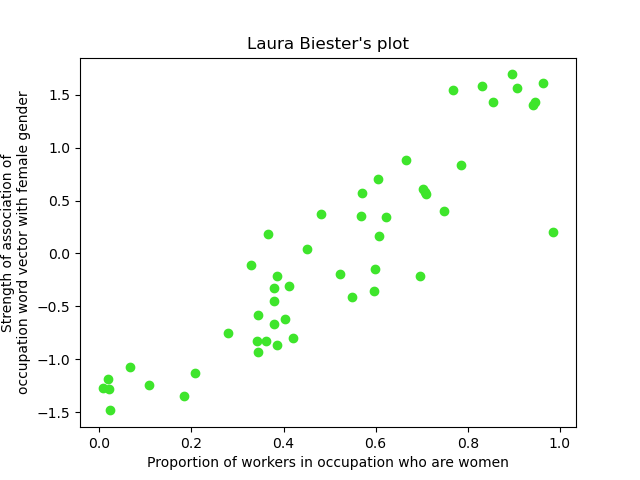
Your plot will be submitted along with your code on gradescope!
Activity 4
The embeddings that are loaded from embeddings_filtered.txt were created using an algorithm called GloVe (Global Vectors for Word Representation). This method was introduced in 2014. Have these methods become less biased since then?
In this activity, we will explore a method called BERT, which is a precursor to modern large language models like ChatGPT. BERT is trained on a task called Masked Language Modeling (MLM).1 In masked language modeling, we take a sentence like "She likes to swim at the beach." and randomly replace words with "[MASK]", as in "She likes to [MASK] at the beach." or "She likes to swim at the [MASK].", or even "She likes to swim [MASK] the beach.". The model is then trained to reconstruct the sentence by predicting the “masked out” words. On the huggingface website, you can input a sentence with a [MASK] token and get the ranked probabilities of various words replacing the [MASK] like this:
"She likes to [MASK] at the beach." | "She likes to swim at the [MASK]." | "She likes to swim [MASK] the beach." |
|---|---|---|
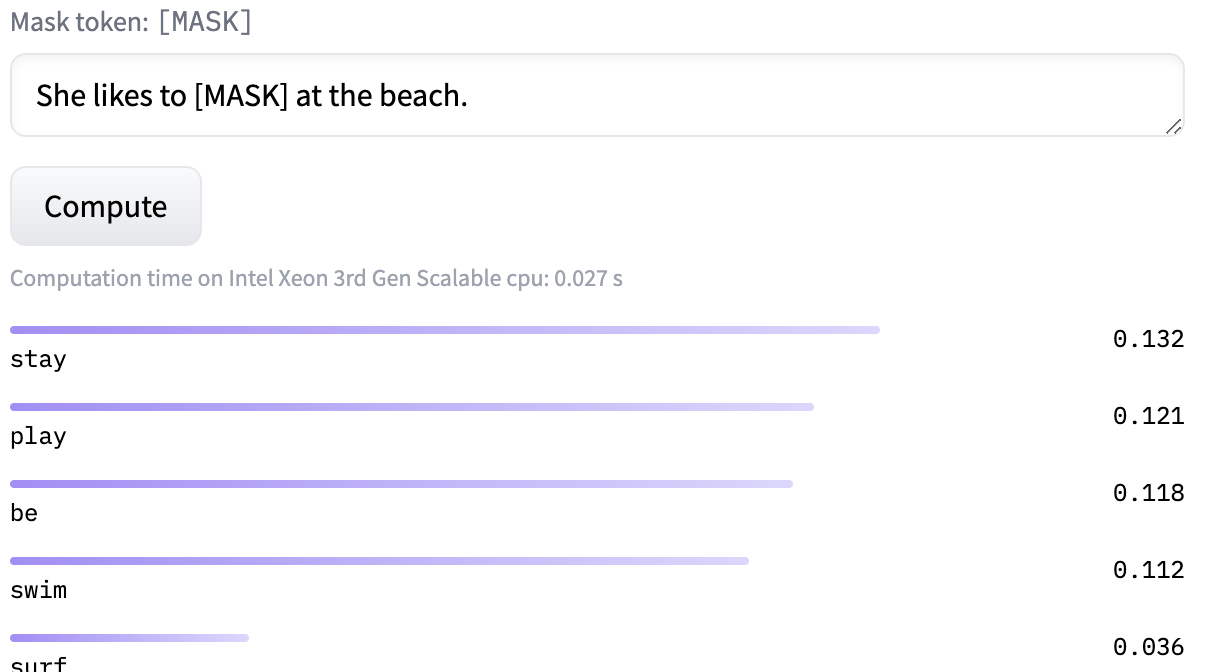 | 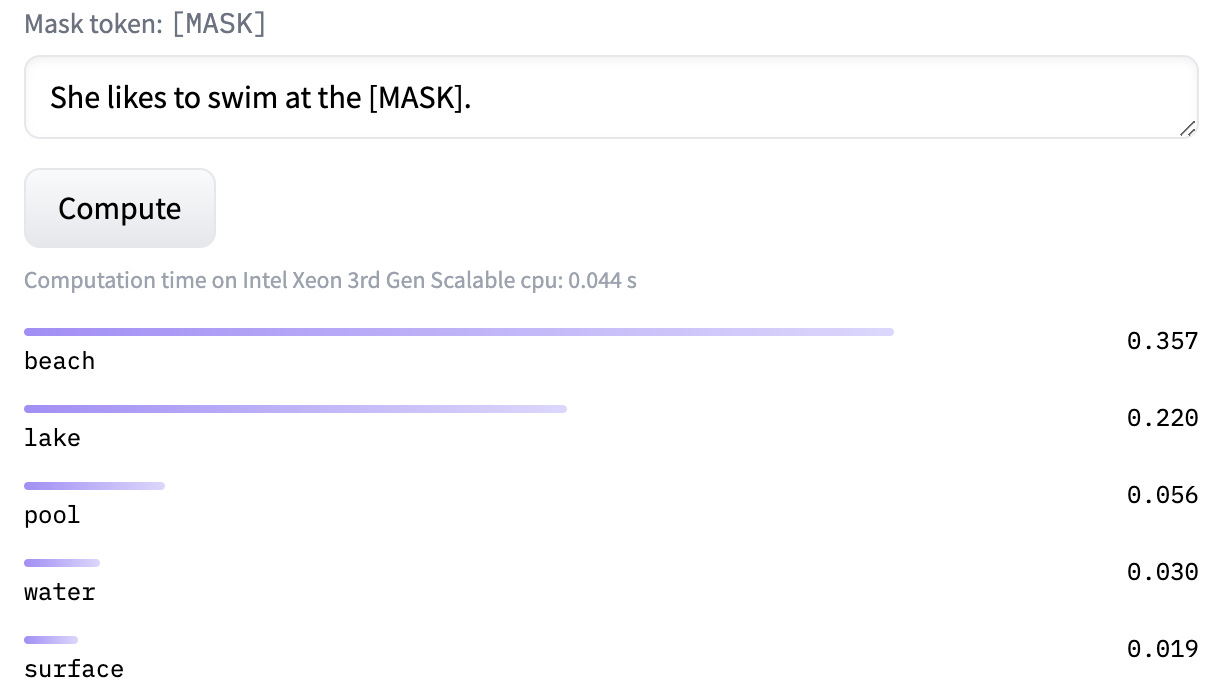 | 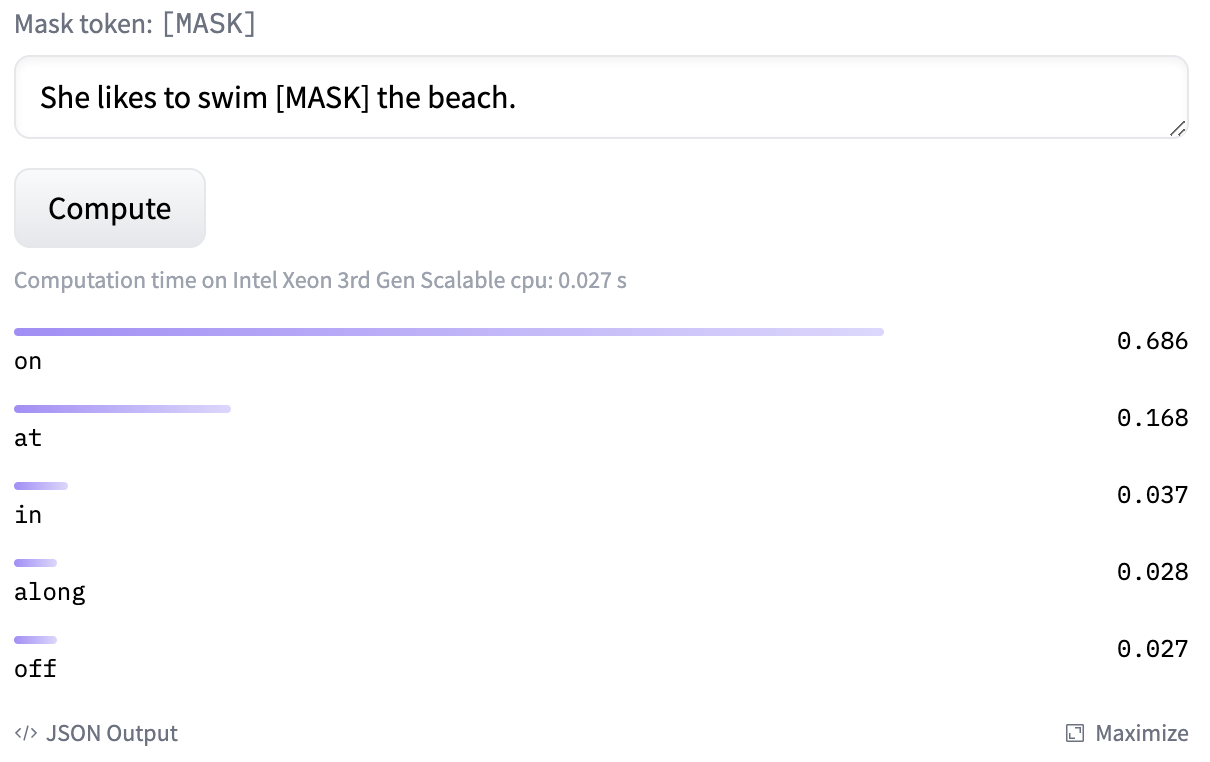 |
For this activity, you will explore how BERT ranks male and female-associated pronouns when they are masked out in a sentence following the structure "[PRONOUN] is a [MAJOR NAME] major.". As a class, we’ll work together to fill out this spreadsheet. The spreadsheet contains all of the majors at Middlebury, and associated prompts such as "[MASK] is an american studies major.". I’ve filled out the first row as an example.
Please “claim” a major on this spreadsheet by putting you and your partner’s names in the Column A next to that major. Then, copy the prompt from the Column C into the textbox in the “inference API” on this website to use the BERT inference model. You will see the scores of five tokens in order. Copy the probabilities associated with "he" and "she" to the corresponding columns (D/E) in the spreadhseet. If either (or both) of the "he" or "she" tokens are not in the top 5, that’s OK - just put 0 in the P(he) and/or P(she) columns in the spreadsheet.
In the ACTIVITY 4 comment at the end of the lab, please write the name of the major that your group members experimented with.
If a large number of students work alone due to the break, we might run out of majors. If you find that there are no majors available in the spreadsheet when you are completing this activity, please choose one of Middlebury’s minors that is not a major and write your full results (the minor that you chose and the probabilities of both "he" and "she") in the ACTIVITY 4 area of the lab assignment.
Activity 5
Discuss what you have observed in this assignment with your partner. The plot shows that there is a clear relationship between the cosine similarities between professions and male/female-associate words and the percentage of female workers in the profession. Additionally, as the spreadsheet for BERT is filled out, I suspect that we will see a similar relationship between the probabilities of male and female pronouns and the percentage of female students in each major at Middlebury.2
Answer the following questions at the end of the lab in the comment labeled “ACTIVITY 5”:
- One word that might be used to describe these word representations is “biased”. Can you think of automated systems in which it would be harmful to society to use these representations of words?
- Can you think of any situations in which the fact that these word representations are biased might be an asset?
- If you use tools like ChatGPT, will this change how you use those tools? If you don’t, does this change your likelihood to use the tools, or the tasks that you might consider using them for?
Please write at least one full sentence for each question.
If you need further inspiration or just want to think more about this topic, consider skimming any of these articles:
- Amazon scraps secret AI recruiting tool that showed bias against women
- Implicit androcentrism: Men are human, women are gendered
- Semantics derived automatically from language corpora contain human-like biases (the paper that this assignment is based on)
Submitting
Submit lab9.py and bias.png on gradescope. Activities 1/2 are autograded, while the rest of the activities are graded manually.